Running
What is grade adjusted pace? GAP explained
You ran a hilly ten miles at 9:30 and your watch says the grade adjusted pace was 9:05. What does that mean, where does the number come from, and how much should you trust it? The short version: it is the flat pace that would have cost the same energy, it comes from one curve measured in 2002, and you should trust it more going up than coming down.
What grade adjusted pace is
Two runs at the same pace are not the same run if one went over a mountain. GAP answers one question: what pace on flat ground would have cost me this much energy? Uphill, your slow actual pace converts to a faster flat-equivalent. Downhill, your quick actual pace converts to a slower one.
It is a comparison tool, not a performance claim. Nobody ran the GAP; it is the pace you would have run if the hill had been flattened and the effort kept the same.
How it is calculated
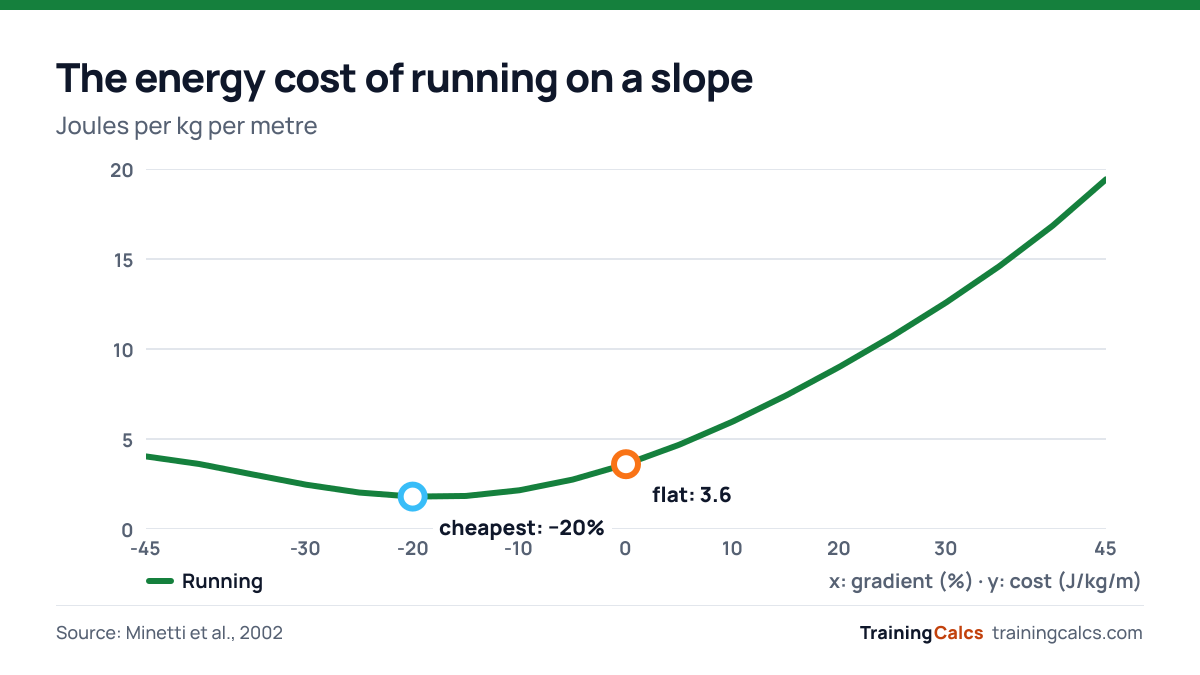
Minetti and colleagues put runners on a treadmill at gradients from −45% to +45% and measured the oxygen cost at each one. The curve they fitted is the whole of GAP:
Cost (J/kg/m) = 155.4i⁵ − 30.4i⁴ − 43.3i³ + 46.3i² + 19.5i + 3.6
Factor = cost ÷ 3.6 · Grade adjusted pace = your pace ÷ factor
On the flat it returns 3.6 J/kg/m — the accepted cost of level running — so the factor is 1 and nothing is adjusted. The hero figure above is that curve, and it is worth a second look, because its shape is the part most explanations skip.
What each gradient costs
| Gradient | Cost (J/kg/m) | Effort vs flat | A 10:00 mile is worth |
|---|---|---|---|
| -20% | 1.80 | 0.50× | 20:00 /mile |
| -15% | 1.84 | 0.51× | 19:37 /mile |
| -10% | 2.15 | 0.60× | 16:44 /mile |
| -5% | 2.75 | 0.76× | 13:07 /mile |
| -2% | 3.23 | 0.90× | 11:09 /mile |
| 0% | 3.60 | 1.00× | 10:00 /mile |
| +2% | 4.01 | 1.11× | 8:59 /mile |
| +5% | 4.69 | 1.30× | 7:41 /mile |
| +8% | 5.43 | 1.51× | 6:38 /mile |
| +10% | 5.97 | 1.66× | 6:02 /mile |
| +15% | 7.42 | 2.06× | 4:51 /mile |
| +20% | 9.01 | 2.50× | 4:00 /mile |
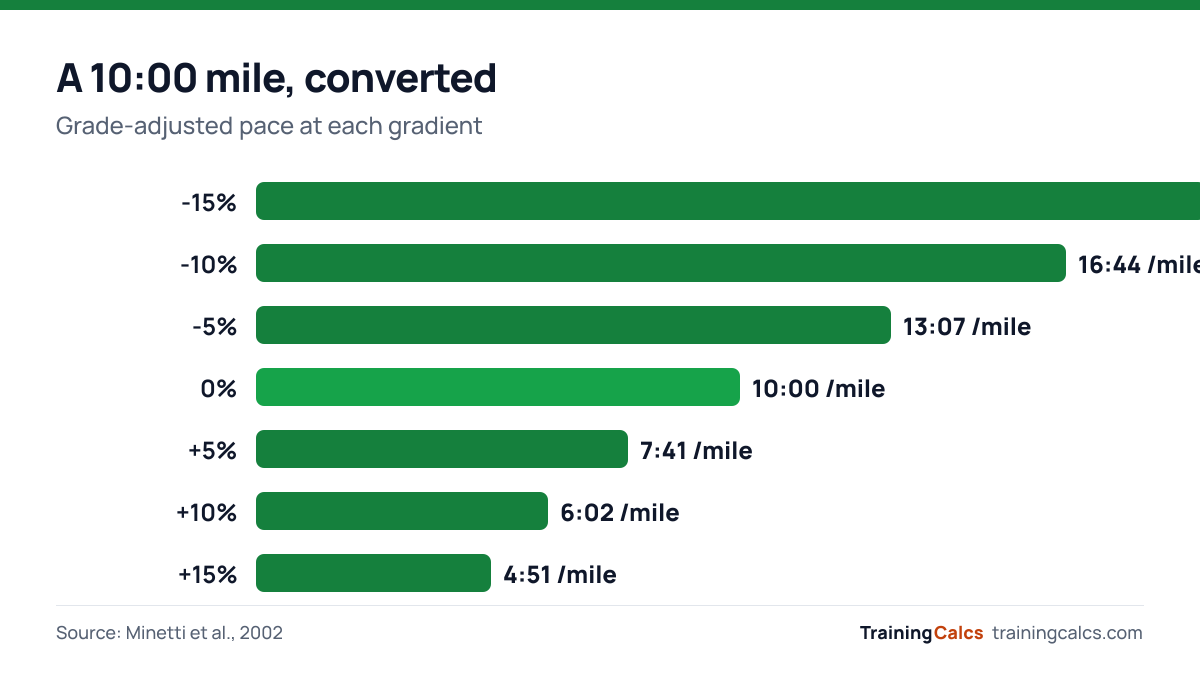
Below about 2% the adjustment is small enough to ignore. At 5% a 10:00 mile is worth 7:41, and at 10% it is worth 6:02. Most road races average under 2% even when they feel hilly; trail races are where this matters.
Why hills are not a wash
“What goes up must come down” is true about the elevation and false about the time. The curve is not symmetrical: climbing 10% costs 66% more than flat, while descending 10% saves only 40%.
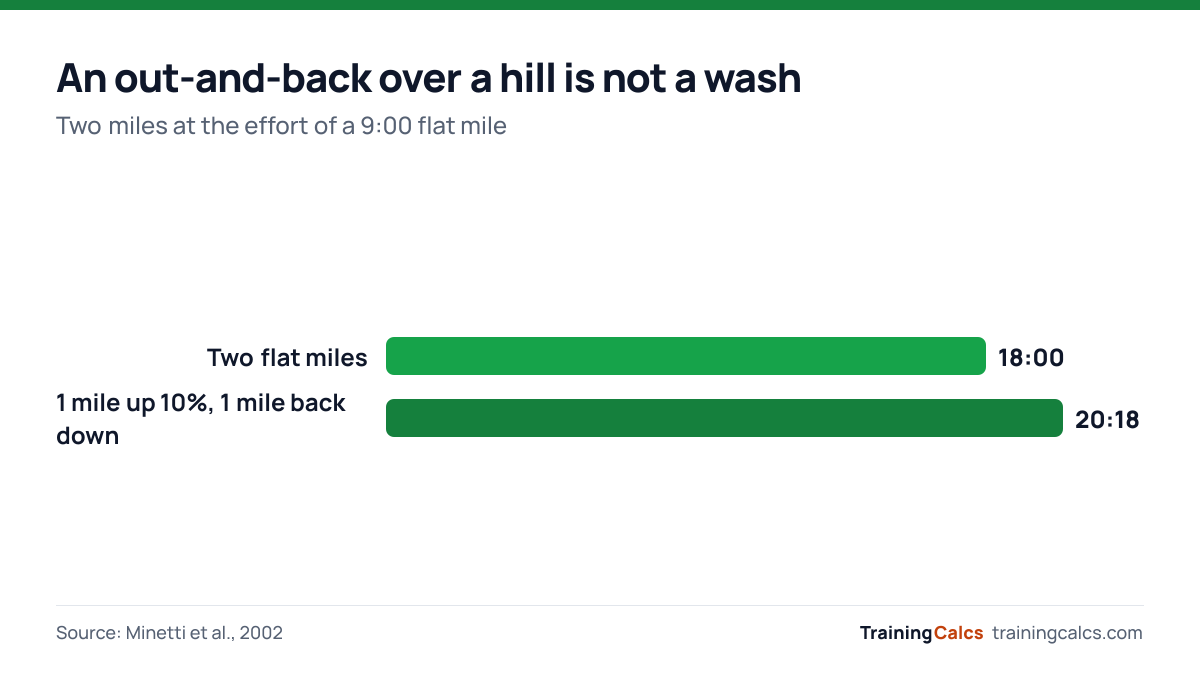
Run at the effort of a 9:00 flat mile and the climb takes 14:55, the descent 5:23. That is 20:18 for the out-and-back against 18:00 for two flat miles — the hill charges you 2:18 and the descent does not refund it.
Where the model flatters you
The curve bottoms out at about −20%, where running costs half what it does on the flat. Take that literally and a 10:00 mile down a 20% grade is worth a 19:00 flat mile, which is nonsense as a description of how that run felt.
The gap is that oxygen cost is not effort. Downhill running is dominated by eccentric muscle work — your quads lengthening under load to brake you on each stride — and that is cheap in oxygen and expensive in muscle damage. The narrative review by Bontemps and colleagues (2020) covers what downhill running does to the muscle and how runners adapt to it; none of that shows up in a J/kg/m figure.
There is a second limit at the top end. A 10:00 mile at +20% converts to a 3:00 flat mile. The arithmetic is right and the meaning is empty: nobody can turn that effort into that speed, and above roughly 10–15% most runners are power-hiking, which the running curve does not describe at all.
Why Strava's number is different
Strava publishes its own GAP model and damps the adjustment on steep descents — a sensible engineering decision for exactly the reason above. Our grade-adjusted pace calculator applies Minetti's curve as it was published, without a correction we would have no source for.
So: uphill, the two figures are broadly similar. Downhill, ours is more generous. If you want to know what the published physiology says, use this one. If you want the number your friends will see on a segment, use Strava's.
Using GAP in training
The honest use is comparison over time. If last week's flat tempo ran at 7:30 and this week's rolling one shows a grade-adjusted 7:28, you held your fitness even though the raw pace looked worse. That is a real signal and hard to get any other way.
The dishonest use is pacing a race by it. Average gradient hides everything that matters: ten kilometres that climb 500 m steadily and ten that climb 500 m in two savage pitches both read 5%, and the second will end your race. For planning, look at the profile section by section — and if your plan involves walk breaks on the climbs, the run-walk calculator works out what they do to your average.
Try the Grade-Adjusted Pace CalculatorFind the flat pace that would cost you the same effort as the hill you just ran.Frequently asked questions
What does grade adjusted pace mean?
It is the pace you would have run on flat ground for the same energy cost as the hilly route you actually ran. It lets you compare a hilly run with a flat one without either ignoring the hills or claiming unlimited credit for them.
How is grade adjusted pace calculated?
From the measured energy cost of running on a slope. Minetti et al. (2002) tested runners at gradients from −45% to +45% and fitted a curve to the oxygen cost. Divide the cost at your gradient by the flat cost of 3.6 J/kg/m to get a factor, then divide your pace by that factor.
Is grade adjusted pace accurate?
Uphill, reasonably — within the range people actually run. Downhill it is optimistic, because energy cost does not capture the braking forces that cause muscle damage, and because you cannot always turn your legs over fast enough to collect the saving.
Why is my GAP different on Strava?
Strava uses its own model and damps the adjustment on steep descents. Uphill figures are broadly similar; downhill, a published Minetti curve applied as fitted will be more generous than Strava's. Neither is wrong — they are different models of the same idea.
Does running downhill make you faster overall?
Not enough to cancel the climb. At the effort of a 9:00 flat mile, a mile up a 10% grade takes about 14:55 and the mile back down about 5:23 — 20:18 for the pair, against 18:00 for two flat miles.
References
- Minetti AE, Moia C, Roi GS, Susta D, Ferretti G. Energy cost of walking and running at extreme uphill and downhill slopes. J Appl Physiol. 2002;93(3):1039–1046. pubmed.ncbi.nlm.nih.gov/12183501/
- Bontemps B, Vercruyssen F, Gruet M, Louis J. Downhill running: what are the effects and how can we adapt? A narrative review. Sports Med. 2020;50(12):2083–2110. pubmed.ncbi.nlm.nih.gov/33037592/
General fitness information, not medical advice. Figures are estimates calculated with the formulas cited above. Check with a doctor or qualified coach before major changes to diet, supplements or training. Read the full medical disclaimer and how we write and check these pages in our editorial policy.