Endurance
Swim pace chart: finish times for every pace and distance
A swim pace chart turns your pace per 100 into a finish time for any distance. Swimmers use it to plan races, set interval targets and check whether a goal time is realistic. Below are complete charts for pool and open-water distances, in metres and yards, for every pace from 1:00 to 3:00 per 100 — followed by how to find your own pace and threshold.
Swim pace chart (per 100 m)
Distances include the common pool events plus 1.9 km and 3.8 km, the swim legs of a half-Ironman and an Ironman triathlon. The last column is the distance covered in one hour.
| Pace /100 m | 100 m | 200 m | 400 m | 800 m | 1,500 m | 1,900 m | 3,800 m | 1 hour |
|---|---|---|---|---|---|---|---|---|
| 1:00 | 1:00 | 2:00 | 4:00 | 8:00 | 15:00 | 19:00 | 38:00 | 6,000 m |
| 1:05 | 1:05 | 2:10 | 4:20 | 8:40 | 16:15 | 20:35 | 41:10 | 5,538 m |
| 1:10 | 1:10 | 2:20 | 4:40 | 9:20 | 17:30 | 22:10 | 44:20 | 5,142 m |
| 1:15 | 1:15 | 2:30 | 5:00 | 10:00 | 18:45 | 23:45 | 47:30 | 4,800 m |
| 1:20 | 1:20 | 2:40 | 5:20 | 10:40 | 20:00 | 25:20 | 50:40 | 4,500 m |
| 1:25 | 1:25 | 2:50 | 5:40 | 11:20 | 21:15 | 26:55 | 53:50 | 4,235 m |
| 1:30 | 1:30 | 3:00 | 6:00 | 12:00 | 22:30 | 28:30 | 57:00 | 4,000 m |
| 1:35 | 1:35 | 3:10 | 6:20 | 12:40 | 23:45 | 30:05 | 1:00:10 | 3,789 m |
| 1:40 | 1:40 | 3:20 | 6:40 | 13:20 | 25:00 | 31:40 | 1:03:20 | 3,600 m |
| 1:45 | 1:45 | 3:30 | 7:00 | 14:00 | 26:15 | 33:15 | 1:06:30 | 3,428 m |
| 1:50 | 1:50 | 3:40 | 7:20 | 14:40 | 27:30 | 34:50 | 1:09:40 | 3,272 m |
| 1:55 | 1:55 | 3:50 | 7:40 | 15:20 | 28:45 | 36:25 | 1:12:50 | 3,130 m |
| 2:00 | 2:00 | 4:00 | 8:00 | 16:00 | 30:00 | 38:00 | 1:16:00 | 3,000 m |
| 2:05 | 2:05 | 4:10 | 8:20 | 16:40 | 31:15 | 39:35 | 1:19:10 | 2,880 m |
| 2:10 | 2:10 | 4:20 | 8:40 | 17:20 | 32:30 | 41:10 | 1:22:20 | 2,769 m |
| 2:15 | 2:15 | 4:30 | 9:00 | 18:00 | 33:45 | 42:45 | 1:25:30 | 2,666 m |
| 2:20 | 2:20 | 4:40 | 9:20 | 18:40 | 35:00 | 44:20 | 1:28:40 | 2,571 m |
| 2:25 | 2:25 | 4:50 | 9:40 | 19:20 | 36:15 | 45:55 | 1:31:50 | 2,482 m |
| 2:30 | 2:30 | 5:00 | 10:00 | 20:00 | 37:30 | 47:30 | 1:35:00 | 2,400 m |
| 2:35 | 2:35 | 5:10 | 10:20 | 20:40 | 38:45 | 49:05 | 1:38:10 | 2,322 m |
| 2:40 | 2:40 | 5:20 | 10:40 | 21:20 | 40:00 | 50:40 | 1:41:20 | 2,250 m |
| 2:45 | 2:45 | 5:30 | 11:00 | 22:00 | 41:15 | 52:15 | 1:44:30 | 2,181 m |
| 2:50 | 2:50 | 5:40 | 11:20 | 22:40 | 42:30 | 53:50 | 1:47:40 | 2,117 m |
| 2:55 | 2:55 | 5:50 | 11:40 | 23:20 | 43:45 | 55:25 | 1:50:50 | 2,057 m |
| 3:00 | 3:00 | 6:00 | 12:00 | 24:00 | 45:00 | 57:00 | 1:54:00 | 2,000 m |
Swim pace chart (per 100 yd)
For 25-yard pools, with the common US pool distances, including the 1,650-yard “mile”.
| Pace /100 yd | 100 yd | 200 yd | 500 yd | 1,000 yd | 1,650 yd | 1 hour |
|---|---|---|---|---|---|---|
| 1:00 | 1:00 | 2:00 | 5:00 | 10:00 | 16:30 | 6,000 yd |
| 1:05 | 1:05 | 2:10 | 5:25 | 10:50 | 17:53 | 5,538 yd |
| 1:10 | 1:10 | 2:20 | 5:50 | 11:40 | 19:15 | 5,142 yd |
| 1:15 | 1:15 | 2:30 | 6:15 | 12:30 | 20:38 | 4,800 yd |
| 1:20 | 1:20 | 2:40 | 6:40 | 13:20 | 22:00 | 4,500 yd |
| 1:25 | 1:25 | 2:50 | 7:05 | 14:10 | 23:23 | 4,235 yd |
| 1:30 | 1:30 | 3:00 | 7:30 | 15:00 | 24:45 | 4,000 yd |
| 1:35 | 1:35 | 3:10 | 7:55 | 15:50 | 26:08 | 3,789 yd |
| 1:40 | 1:40 | 3:20 | 8:20 | 16:40 | 27:30 | 3,600 yd |
| 1:45 | 1:45 | 3:30 | 8:45 | 17:30 | 28:53 | 3,428 yd |
| 1:50 | 1:50 | 3:40 | 9:10 | 18:20 | 30:15 | 3,272 yd |
| 1:55 | 1:55 | 3:50 | 9:35 | 19:10 | 31:38 | 3,130 yd |
| 2:00 | 2:00 | 4:00 | 10:00 | 20:00 | 33:00 | 3,000 yd |
| 2:05 | 2:05 | 4:10 | 10:25 | 20:50 | 34:23 | 2,880 yd |
| 2:10 | 2:10 | 4:20 | 10:50 | 21:40 | 35:45 | 2,769 yd |
| 2:15 | 2:15 | 4:30 | 11:15 | 22:30 | 37:08 | 2,666 yd |
| 2:20 | 2:20 | 4:40 | 11:40 | 23:20 | 38:30 | 2,571 yd |
| 2:25 | 2:25 | 4:50 | 12:05 | 24:10 | 39:53 | 2,482 yd |
| 2:30 | 2:30 | 5:00 | 12:30 | 25:00 | 41:15 | 2,400 yd |
| 2:35 | 2:35 | 5:10 | 12:55 | 25:50 | 42:38 | 2,322 yd |
| 2:40 | 2:40 | 5:20 | 13:20 | 26:40 | 44:00 | 2,250 yd |
| 2:45 | 2:45 | 5:30 | 13:45 | 27:30 | 45:23 | 2,181 yd |
| 2:50 | 2:50 | 5:40 | 14:10 | 28:20 | 46:45 | 2,117 yd |
| 2:55 | 2:55 | 5:50 | 14:35 | 29:10 | 48:08 | 2,057 yd |
| 3:00 | 3:00 | 6:00 | 15:00 | 30:00 | 49:30 | 2,000 yd |
How to read the chart
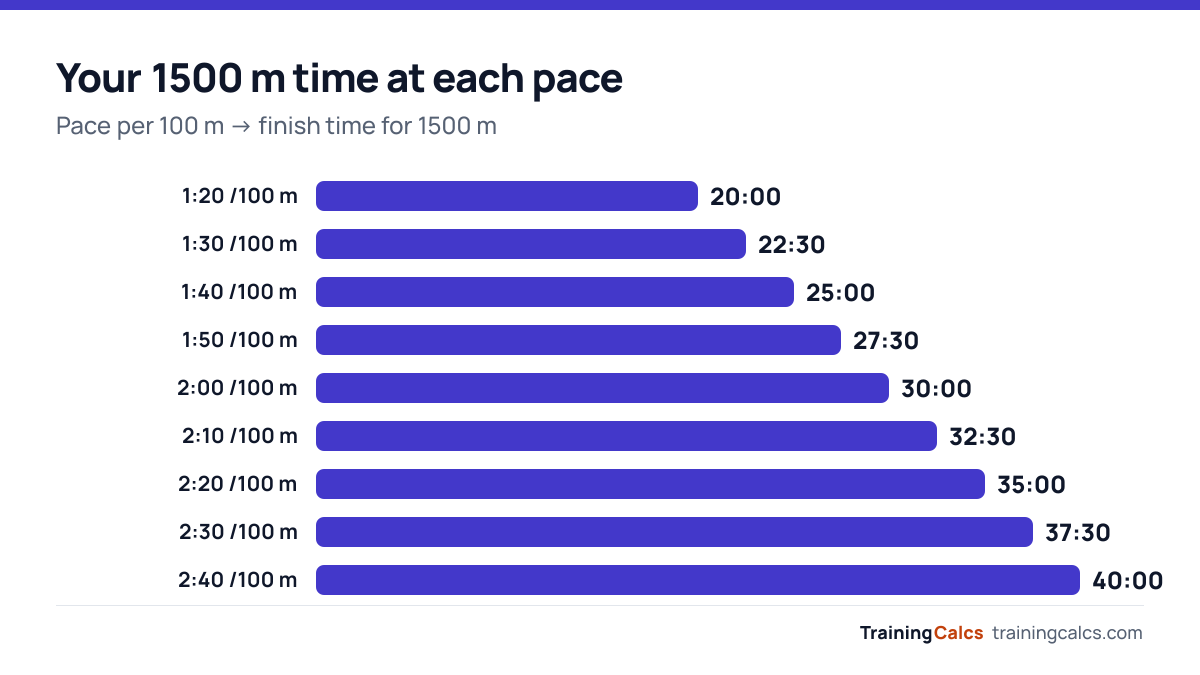
Find your pace per 100 in the left column and read across. At 2:00 per 100 m, you would swim 400 m in 8:00 and 1500 m in 30:00, and cover 3,000 m in an hour. The chart is simple arithmetic:
Finish time = pace per 100 × distance ÷ 100
That also shows why small pace gains matter: every 10 seconds per 100 m saves 2:30 over 1500 m and 6:20 over 3.8 km.
How to find your pace
U.S. Masters Swimming suggests timing a shorter swim, such as 100 at a moderate effort, and using that as a base for longer swims. A more reliable approach for longer distances is to swim a steady 400 or 1,000 and divide:
Pace per 100 = time ÷ distance × 100
For example, 1500 m in 25:00 is 1500 seconds ÷ 1500 × 100 = 100 seconds, or 1:40 per 100 m. The swim pace calculator does this for any distance and time, and predicts finish times for other distances.
Metres vs yards
Most pools outside the US are 25 m or 50 m; many US pools are 25 yards. One yard is 0.9144 m, so 100 yd is 91.44 m and the same effort looks about 9% faster per 100 yd. To convert, divide a yard pace by 0.9144 to get the metre pace, or multiply a metre pace by 0.9144 to get the yard pace. A 1:40 per 100 m pace is about 1:31 per 100 yd.
Finding your threshold pace (CSS)
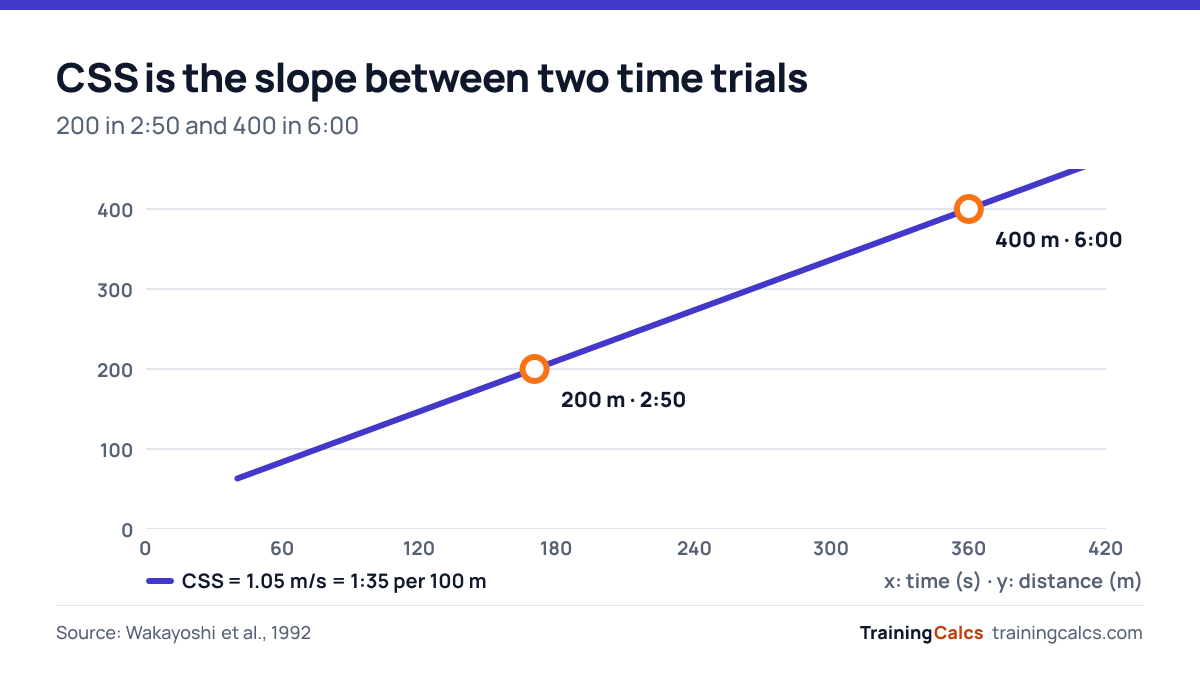
Critical swim speed (CSS) estimates your threshold pace: roughly the fastest pace you can hold for a long, continuous swim. It comes from critical velocity, which Wakayoshi and colleagues applied to swimmers in 1992: when you plot distance against time for all-out swims, the points fall on a nearly straight line, and its slope is a speed you can sustain.
- Warm up for 10–15 minutes with easy swimming, drills and a few build-ups.
- Swim 400 all-out from a push start, pacing it evenly. Note the time.
- Recover with 5–10 minutes of easy swimming.
- Swim 200 all-out from a push start. Note the time.
CSS pace per 100 = (400 time − 200 time) ÷ 2
| 400 time | 200 time | CSS pace /100 |
|---|---|---|
| 8:00 | 3:45 | 2:08 |
| 7:00 | 3:20 | 1:50 |
| 6:00 | 2:50 | 1:35 |
| 5:00 | 2:22 | 1:19 |
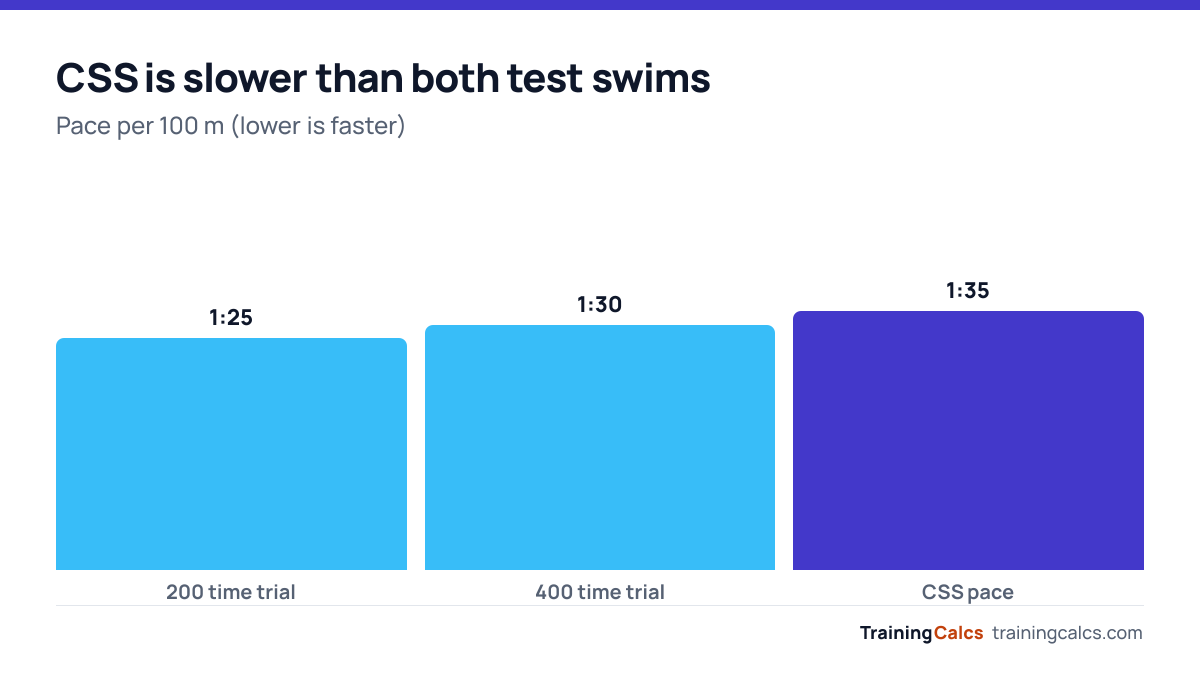
Your CSS pace should be slower than the average pace of both test swims, and your 400 should take a little more than twice as long as your 200. If it takes less than about 1.8 times as long, one of the swims probably wasn’t all-out. The swim pace calculator has a CSS mode.
Using the chart in training
- Set interval targets. Read off your target time for 100s, 200s or 400s at goal pace, then add a short rest.
- Threshold sets. Swim repeats such as 8–10 × 100 at CSS pace with 10–15 seconds’ rest.
- Plan a race. Pick your realistic pace and read off the finish time; use it to seed yourself or plan a triathlon swim.
- Track progress. Retest every 6–8 weeks; a faster pace for the same effort is the clearest sign of improvement.
Why real times differ
The chart assumes you hold one pace for the whole distance. In reality, most swimmers slow down as distances get longer, so the 1,500 m and 3.8 km columns are best cases unless your pace comes from a swim of similar length. Open water adds sighting, waves, currents and wetsuits; pools add turns and push-offs, which make pool times a little faster. Use the chart as a planning tool and adjust from your own experience.
Try the Swim Pace CalculatorPace per 100 m or yards, race finish times and your CSS threshold pace.Frequently asked questions
How do I read a swim pace chart?
Find your pace per 100 in the left column, then read across to the distance you want. At 2:00 per 100 m, the chart shows 8:00 for 400 m and 30:00 for 1500 m.
How do I work out my swim pace per 100?
Divide your time in seconds by the distance and multiply by 100. For example, 1500 m in 25:00 is 1500 ÷ 1500 × 100 = 100 seconds, or 1:40 per 100 m.
How far can I swim in an hour?
Divide 3,600 by your pace in seconds and multiply by 100. At 2:00 per 100 m that is 3,000 m, and at 1:40 per 100 m it is 3,600 m — if you can hold the pace for the full hour.
How do I convert a yard pace to a metre pace?
Divide the pace per 100 yd by 0.9144. A 1:30 per 100 yd pace is about 1:38 per 100 m.
What is CSS in swimming?
Critical swim speed: an estimate of your threshold pace, the fastest pace you can hold for a long continuous swim. Find it from an all-out 400 and 200: (400 time − 200 time) ÷ 2 gives your CSS pace per 100.
References
- U.S. Masters Swimming. Fitness pace chart. www.usms.org/fitness-and-training/fitness-pace-chart
- Wakayoshi K, Ikuta K, Yoshida T, et al. Determination and validity of critical velocity as an index of swimming performance in the competitive swimmer. Eur J Appl Physiol Occup Physiol. 1992;64(2):153–157. pubmed.ncbi.nlm.nih.gov/1555562/
- Wakayoshi K, Yoshida T, Udo M, et al. A simple method for determining critical speed as swimming fatigue threshold in competitive swimming. Int J Sports Med. 1992;13(5):367–371. pubmed.ncbi.nlm.nih.gov/1521952/
General fitness information, not medical advice. Figures are estimates calculated with the formulas cited above. Check with a doctor or qualified coach before major changes to diet, supplements or training.